

PhysgGlobal378 Calibration Files
|
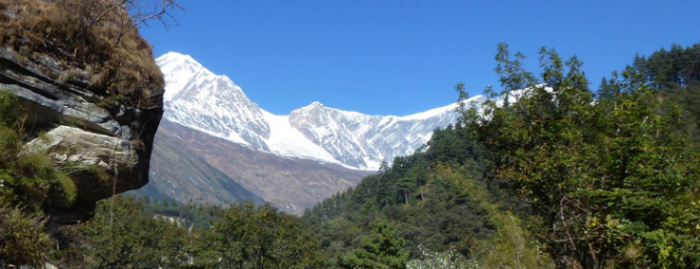
The image above shows sub-tropical and warm temperate vegetation in the foreground, cool temperate vegetation in the middle distance and icefields in the Himalayas in the far distance, typifying the range of climates and vegetation types encapsulated in the global data sets. |
Expanding data sets for more complete biogeographic and climate coverage is a goal of the CLAMP leaf form/climate research. The original CLAMP data set included 106 sites, mostly from North America, Puerto Rico and Japan. While capturing a wide range of climates, it had limited geographic range. Subsequently, regional floras outside of the Holarctic floristic province (e.g. southern Africa, Steart et al., 2010), and those experiencing different climate patterns (e.g. Asian Monsoon, Jacques et al., 2011; Srivastava, 2012) were added. The PhysgGlobal378 data set includes sites from these earlier compilations and brings together sites from New Zealand, Australia (as reported in Kennedy et al., (2014), Thailand (first introduced in the PhysgAsia2 data set of Khan et al., 2014), South America and Europe. Because some of the data are historic not all scoresheets are available.
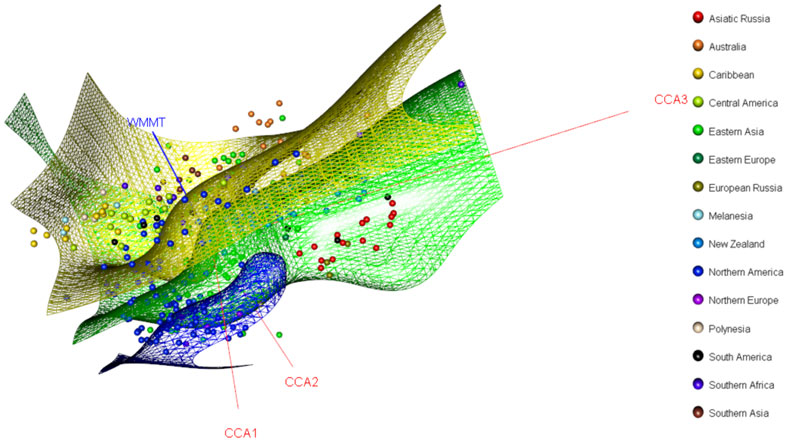
There are still geographic 'gaps' in that the equatorial rainforests are not yet sampled, but the PhysgGlobal378 data set is the largest to date. Because a wide range of climatic regimes are represented the structure of physiognomic space is complex and simple linear vectors represent the main climate trends only poorly (see the figure below), so degrading the predictive precision of this data set. It should therefore be regarded only as experimental.
What the PhysgGlobal378 and the accmpanying meteorological data sets are most useful for is indicating which of the global subsets should be used for your analysis. For example if you run your fossil dataset using first the PhysgGlobal378 calibration you will see where your fossil site plots in physiognomic space. If it plots with the modern monsoon-influenced sites then it would be sensible to use the PhysgAsia data sets for further, higher precision, analysis. If it plots with non-monsoonal sites such as those from North America then use of Physg3brcAZ or Physg3arcAZ calibrations would be appropriate.
To download the PhysgGlobal378 data set click here.
To download the HiResGRIDMetGlobal378 dataset click here.
To see the scoresheets click here.
 |
|
| This image shows three isotherm surfaces for Warm Month Mean Temperatures (WMMT) of 15°C (blue), 20°C (green) and 25°C (yellow) in thre dimensional physiognomic space defined by the PhysgGlobal378 data set. Temperature data are those from the GridMetGlobal378 climate data. The CLAMP WMMT vector is shown as a blue line, whileCCA axes 1-3 are shown as red lines. For further details see Yang et al. (2015). This illustrates the complexity of physiognomic space with large global data sets. |
