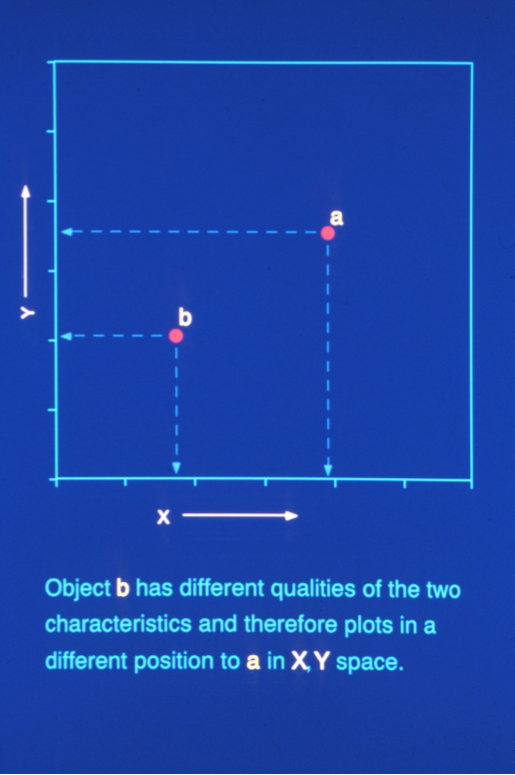
'Ordination' is the term given to a family of statistical techniques that order entities or objects based on attributes that they share. In the case of CLAMP the entities are vegetation samples and the attributes are the aggregate leaf character scores (the trait spectra) derived from each sample. As with all statistics the aim of the analysis is to simplify the data to extract any patterns, such as those derived from environmental relationships, that may exist. In a simple two attribute case objects (e.g. samples) can be positioned in two dimensional space in terms of the amounts of two attributes or characeristics (e.g. leaf characters) they possess. The position of sample (a) is determined by the amounts of the attributes X and Y that it has. Similarly is sample (b) has different amounts of attributes X and Y it will plot in a different position. |
 |
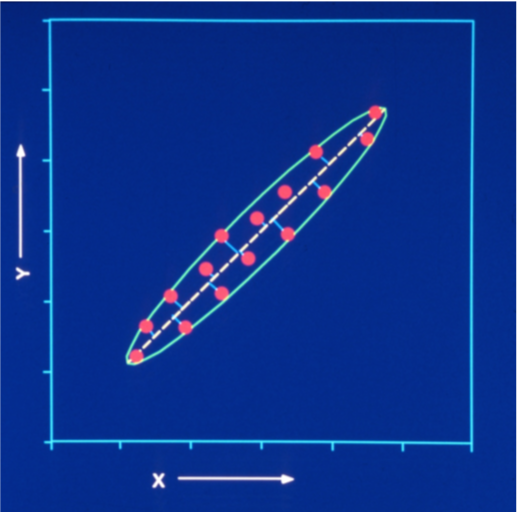
In reality natural systems have far more than two attributes, but we will stick with two for the time being. As more samples are added they may well form a cloud that has a major axis and a minor axis. The dotted line, basically a regression line, represents the major axis of the ellipse and the major axis of variation in the object cloud in X-Y space. Projecting the positions of the objects normally on to the regression line orders the objects along this axis. |
 |
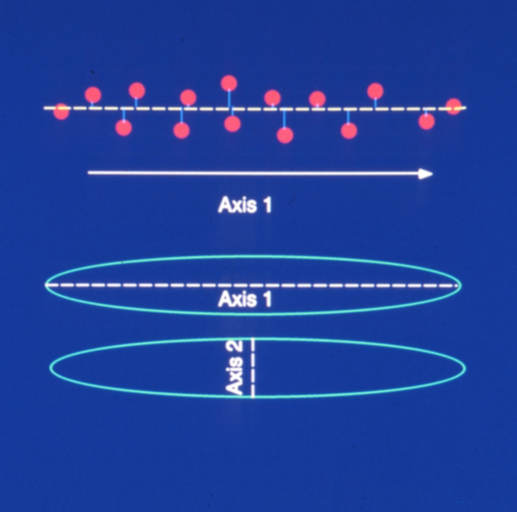
By ordering the samples along the longest axis of variation the data can be simplified while simultaneously retaining most of the important information.
The minor axis of the ellipse represents the second most important axis of variation in X-Y space. Only ordering objects along this axis, and not Axis 1, is an inefficient summary of the pattern and introduces much distortion. |
 |
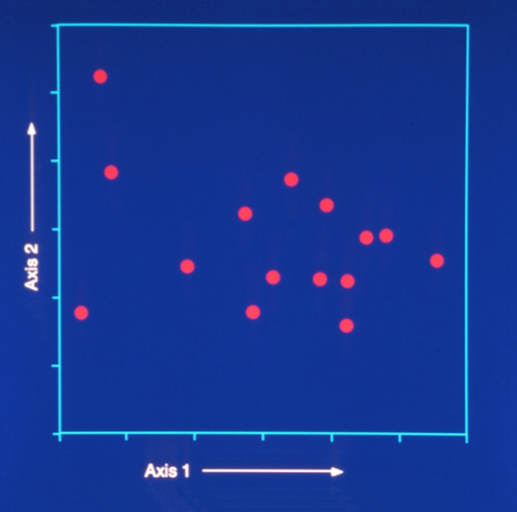
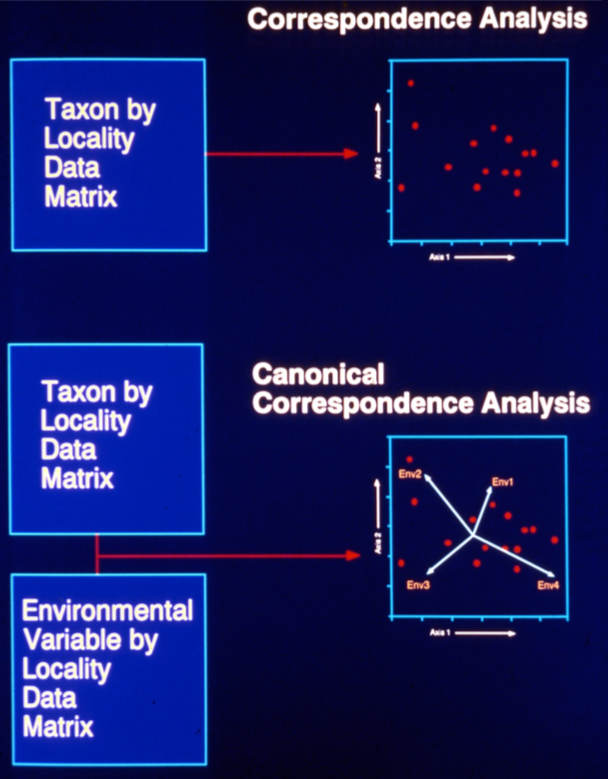
In this ordination plot Axis 1(the axis of greatest variation) is shown against Axis 2 (the axis of next greatest variation). Both axes are scaled identically even though they represent different amounts of variation. If more than two attributes are measured they can be represented on axes 3, 4, 5 and so on. Several statistical techniques use such multidimensional ordering, e.g. Principal Components Analysis and Correspondence Analysis. Because environmental trends within the multi-dimensional space are determined subjectively in these techniques they are termed 'indirect ordinations'. |
 |
In contrast Canonical Correspondence Analysis (CANOCO) (ter Braak, 1986) is a direct ordination method that positions environmental trends (vectors) on ordered samples explicitly using environmental data. In the case of CLAMP it is climate data. In a CANOCO ordination environmental trends are plotted as arrows extending from the origin, illustrating the relationship between the samples and those trends. |
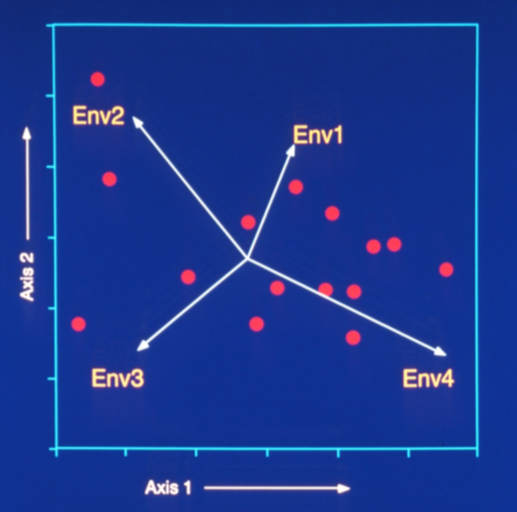 |
CANOCO is a popular and powerful method used widely in plant ecology for analyzing complex patterns of plant distributions in terms of environmental influences. This is because it has few constraints in terms of the distribution of variables (it tolerates non-normally distributed data), missing data, and correlations between variables. CANOCO underpins CLAMP. In CLAMP the taxon by locality data matrix is the physiogmic file and the environnmental variable by locality data matrix is the meteorological data file used for calibration. A third file contains the leaf physiognomy scores for the fossil leaves. Because they lack observed climate data the sites in this file are treated as passive within the multivariate cloud of calibration sites. |
 |