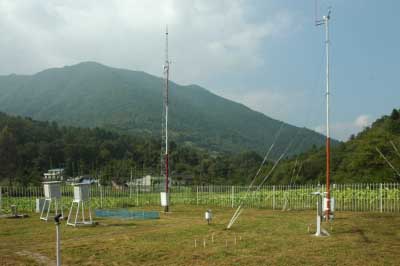
2. Climate MeasurementsClimate data are collected at standardized meteorological stations, always in clearings and, more often than not, in agriculturally modified landscapes and urban centres. The data collected this way do not record the conditions that leaves experience in, or beneath, a forest canopy. Climate, being a description of average weather, is usually framed in terms of 30-year averages or ‘normals’. Measurements are taken, sometimes hourly, across thousands of stations worldwide and inevitably the instruments used often differ, are calibrated differently, data are collected over different periods of time and often data are missing due to, for example, instrument failure or political upheaval.
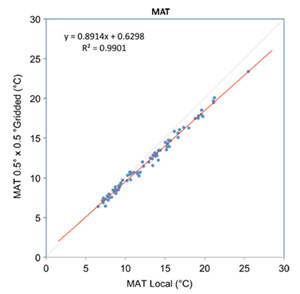
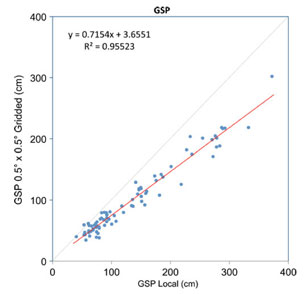
In the CLAMP MET3ar and MET3br data sets Wolfe and others tried to collect climate data close to their vegetation sites. To do this, continuous 30-year data sets were not always available and between stations different 30-year periods often had to be used. Also, climate stations were at different distances from the vegetation sites and, although every effort was made to find climate stations at the same altitude as the vegetation site, this was not always possible. Inevitably this introduces a certain amount of variation into the data unconnected with that due to the actual climate. To try to standardize CLAMP climate data Spicer et al. (2009) introduced the GRIDMET3ar/br data sets. These are based on the New et al. (1999) global gridded data sets interpolated from, in the case of MAT, over 12000 meteorological stations distributed worldwide that yielded records for the 1961-1990 inclusive 30-year period. Climate stations were not uniformly distributed and so regional ‘tiling’ was used in an attempt to standardize the data. By taking data from so many stations for the same 30-year period some of the ‘noise’ in the MET3ar/br files is removed but other uncertainties are introduced. For example instrumentation and the quality of data differences are larger on a global scale than over the more restricted regional scales of the MET3ar/br datasets. Quantifying the uncertainties in gridded data is too complex to review here but a good account is given in New et al. (1999). The largest uncertainties are associated with precipitation measurements, in part because of small-scale variations that are not captured by the spatial distribution of the meteorological stations (including biases towards easily accessible lowland sites). Moreover to correct for altitude at specific sites further spatial interpolations and altitude corrections are made (Spicer et al., 2009) that introduce additional uncertainties. These are difficult to quantify because appropriate station data are missing. Comparisons between the ungridded and gridded data are given in Yang et al. (2011) and while MAT shows a good agreement understandably precipitation measures do not. Because gridded data, with their associated uncertainties, are used in climate modelling experiments there is a strong case for using these data over the ungridded despite the larger uncertainties involved.
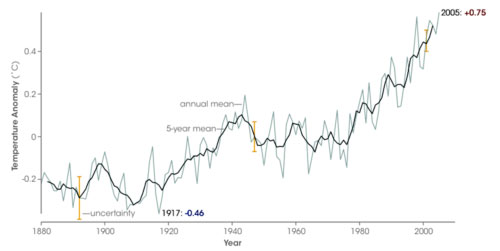
Within a given region climate varies both with altitude and aspect. Climate stations are often sited on flat open land and a lot of this variation is not captured and thus not reflected in gridded data. In the GRIDMET data sets some adjustment for altitude is made, but at the moment none is made for aspect. This is an area where, potentially, precision could be improved. Leaf physiognomic adaptation to climate is made through evolutionary selection coupled with phenotypic plasticity. Aditionally species, and their foliar physiognomic spectra, are able to migrate over time and so, to some extent, track changing climates. Thus the features we score at any given site are the response to climate not in any particular year but over centuries. During that time there will be variations from year to year as well as longer term trends. We do not have instrumental records spanning evolutionary timescales, but an idea of the variation we are talking about here can be gauged from the climate trends observed over the last 130 years or more.
Thus the features displayed in leaf form can only approximate to the observed climate. It is also worth remembering that these variations apply equally to all climate proxies, including those based on isotopes, because they are all calibrated using observed modern climate. Inter-annual variation is likely to be less in the ocean, but ocean temperature variations are less well documented than air temperatures over land. |
|||||||||||||||
 |
 |
Uncertainties (in CLAMP and other climate proxies) |
Overview |
Taphonomic |
Climatic |
Environmental |
Sampling & Scoring |
CLAMP Stats. |