The Lost World of the Arctic
| A Warm Arctic | Climate Change | Polar Light Regime | Paleo-Arctic Forests | Paleo-Arctic Fauna |
|---|
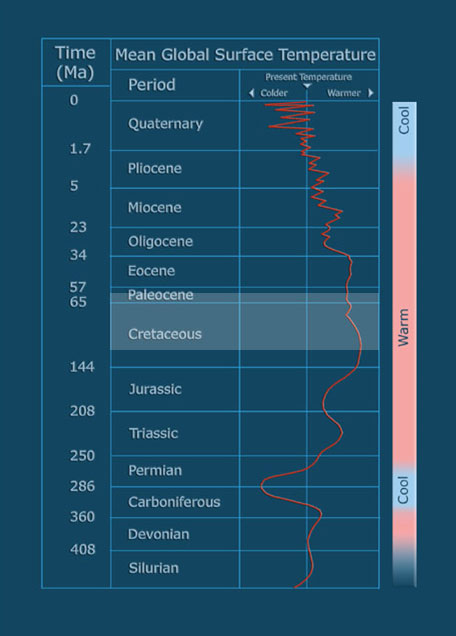
Climate ChangeThe graph on the right shows the estimated average global surface temperature over the past 500 million years or so. The temperature is shown relative to the present day but note that absolute temperatures are not shown. This is because although there are numerous geological indicators of past climate they are not all calibrated the same way so the most 'honest' way of representing climate change is in relative terms. Note also that as we approach the present day the 'wiggliness' of the temperature line becomes more marked. This is not because change has been more rapid in recent times but because the amount of data we have increases and so we can obtain more detail on the change. For most of the past 500 million years the average global surface temperature has been warmer than now. This means that there is an enormous amount of information in the rock record (e.g. minerals, fossils, chemistry) that shows us how our world works in a so called 'greenhouse' mode. There are numerous causes of climate change. The energy that drives climate comes from the Sun so any fluctuations in that energy will cause change on Earth. However such fluctuations have only a small overall affect compared to changes in the shape of Earth's orbit, the angle of tilt of Earth's rotational axis, the relative positions of the continents, ocean currents, the composition of Earth's atmosphere, and albedo (reflectivity). Rapid climate change (in geological terms that is change measured in thousands of years or less) is driven by the last two of these variables and these are the two variables that human activity mostly influences. Whatever the cause climate change is most strongly expressed at the poles and the focus of this catalogue is the plant fossil record in the Arctic throughout one of the warmest intervals shown on the graph - the late Cretaceous and early Paleocene (highlighted in light blue). Figure modified from Frakes (1979). |
 |